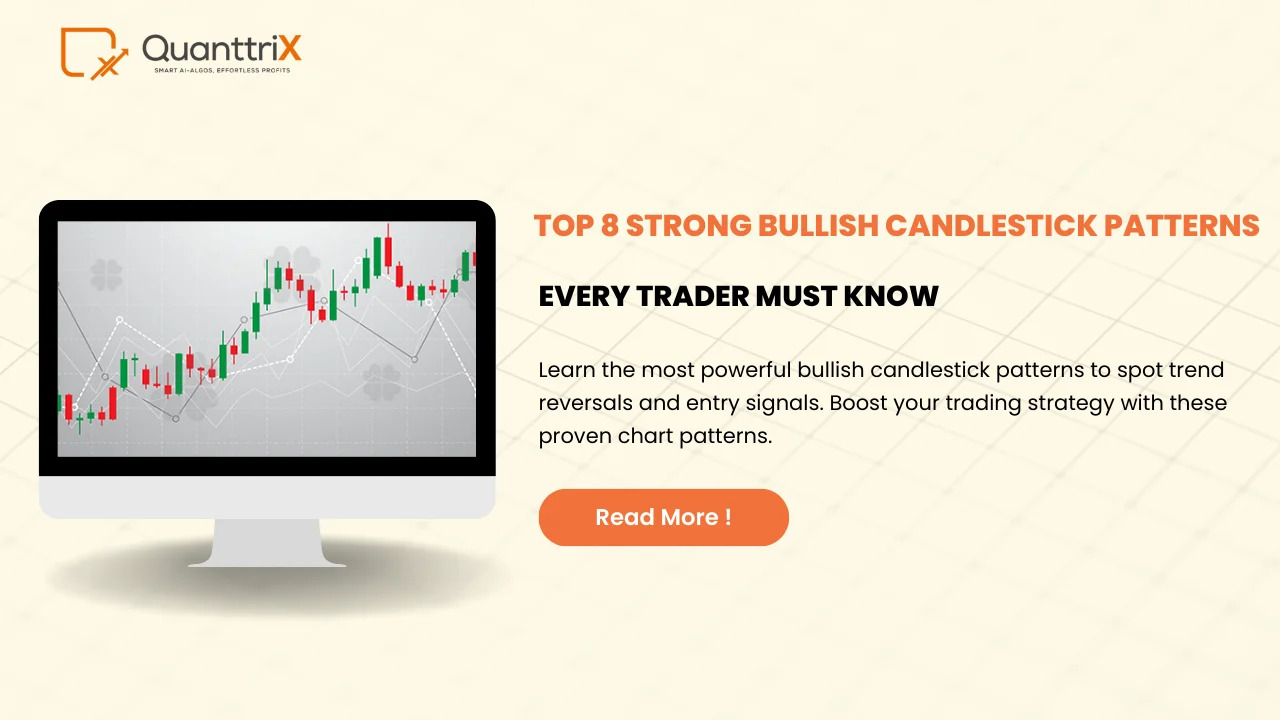
Strong Bullish Candlestick Patterns: Your Guide to Smarter Trading
Introduction
Have you ever wondered how seasoned traders predict market uptrends with surprising accuracy? It’s not magic—it’s pattern recognition, especially in the form of strong bullish candlestick patterns. These visual clues on a price chart can signal powerful buying momentum and potential upward movement. And when paired with modern tools like automated trading software, it becomes even easier to ride the bullish waves with confidence.
In this guide, we’ll explore the most reliable bullish candlestick patterns, explain their significance in everyday terms, and link them to real-world trading strategies. Plus, we’ll touch on the algo trading software price, helping you choose tools that match your goals and budget.
Explore strong bullish candlestick patterns & learn how algo trading software price, algorithmic trading software price, and automated trading software affect your success.
What Are Candlestick Patterns?
Candlestick patterns are visual representations of price movements in the market over a specific time frame. Each candle tells a story—where the price opened, how high and low it went, and where it closed.
They originated in 18th-century Japan (yes, really!) to track rice prices. Today, they’re the go-to for technical analysts and traders worldwide.
Why Bullish Patterns Matter
Strong bullish candlestick patterns are your early indicators that buyers are stepping in with strength. They help you identify entry points with a higher probability of success.
If you’re tired of guessing when to buy, recognizing these patterns can turn your approach from hopeful to strategic.
The Psychology Behind Bullish Patterns
Imagine a tug-of-war. On one side are the buyers, on the other, the sellers. Bullish patterns appear when buyers start pulling harder—and win. These patterns visually capture that shift in power, giving you an edge if you’re paying attention.
Bullish Engulfing Pattern
What it looks like: A small red candle followed by a large green candle that completely “engulfs” it.
What it means: Buyers have taken over. It’s a strong reversal signal, especially after a downtrend.
Key tip: Volume matters. A bullish engulfing with high volume? That’s a golden entry point.
Hammer and Inverted Hammer
Hammer: Looks like a lollipop—a small body on top with a long lower wick.
Inverted Hammer: A small body at the bottom with a long upper wick.
Interpretation: Both appear after a downtrend and signal that buyers are testing strength.
Use case: Wait for confirmation—a green candle following the hammer increases reliability.
Morning Star Pattern
Structure: A three-candle pattern:
- Red candle (strong sell-off)
- Small candle (indecision)
- Green candle (strong buyback)
Why it matters: This is the sunrise after a dark night—indicating a trend reversal.
Pro tip: Works well on daily charts in combination with support levels.
Piercing Line Pattern
Formation: Appears over two candles. The first is red; the second opens lower but closes more than halfway into the red candle’s body.
Signal strength: It shows that buyers are reclaiming control. This can often lead to multi-day rallies.
Three White Soldiers Pattern
Visual: Three consecutive green candles, each closing higher.
Message: This isn’t just optimism; it’s a charge forward. Think of it like an army of buyers advancing one day at a time.
Risk note: Check for overbought signals to avoid chasing at the top.
Marubozu Candle: No Shadows, All Strength
Definition: A full-bodied candle with no upper or lower shadows.
Implication: No doubt in the market. Buyers were in control from open to close.
Ideal scenario: Spotting a green Marubozu after a pullback = confidence to go long.
Rising Three Method Pattern
Setup:
- Strong green candle
- 3-4 small-bodied red candles (pullback)
- Another strong green candle
Explanation: It’s like a team resting before pushing again. The trend pauses—but doesn’t reverse.
Best for: Spotting continuation rather than reversal trades.
Pattern Confirmation Techniques
Before acting on a pattern, confirm it using:
- Volume spikes
- Support and resistance zones
- Moving averages
Why? Because patterns alone aren’t foolproof. Confirmation increases accuracy.
Real-Life Analogy: Candles as Storytellers
Think of candles as characters in a story. A red candle might be fear, a green one might be hope. When several candles tell a bullish tale together—it’s like reading the climax of a movie where the hero rises.
Role of Automated Trading Software
In today’s fast-paced markets, recognizing patterns is one thing. Acting on them instantly is another.
That’s where automated trading software comes in. These tools can:
- Scan charts 24/7
- Detect strong bullish candlestick patterns
- Place trades without hesitation
Perfect for those who don’t want to sit in front of charts all day.
Algo Trading Software Price Explained
You might be wondering, “What’s the algo trading software price like?”
Well, it varies based on features:
- Basic Plans: ₹1,500 – ₹5,000/month
- Advanced Tools with AI/ML: ₹10,000 – ₹50,000/month
- Enterprise Solutions: Custom pricing
Some offer backtesting, real-time scanning, and integration with brokers. The algorithmic trading software price often reflects its speed, support, and complexity.
Choosing the Right Algorithmic Trading Tool
Before choosing, ask:
- Does it detect strong bullish candlestick patterns?
- Is the automated trading software compatible with my broker?
- What’s the algorithmic trading software price versus my budget?
- Can I try a demo first?
The best tool is one that fits your strategy, not just the one with the most features.
Conclusion: Pattern Power + Smart Tools
Spotting strong bullish candlestick patterns is like catching the wind at your back—it gives your trades the push they need. But in a world where markets move at lightning speed, manual execution isn’t enough.
Pairing your knowledge with automated trading software transforms insight into action. And when you consider the algo trading software price and value it offers, it becomes clear: smart trading is a mix of pattern recognition and powerful tools.
FAQs
1. What are strong bullish candlestick patterns?
They are chart patterns that suggest strong buying pressure and potential price increases. Examples include Bullish Engulfing, Morning Star, and Three White Soldiers.
2. How accurate are bullish candlestick patterns?
When combined with volume and other indicators, they can offer high-probability setups. However, they are not 100% foolproof and require confirmation.
3. Can automated trading software detect candlestick patterns?
Yes, many modern automated trading software solutions can scan and execute trades based on these patterns in real time.
4. What is the typical algo trading software price in India?
It ranges from ₹1,500/month for basic tools to ₹50,000/month or more for advanced algorithmic trading platforms.
5. Is algorithmic trading software suitable for beginners?
Yes, as long as the software offers a user-friendly interface, educational support, and demo access. It’s crucial to understand the basics before relying entirely on automation.